By Living Room Realty, February 8, 2018
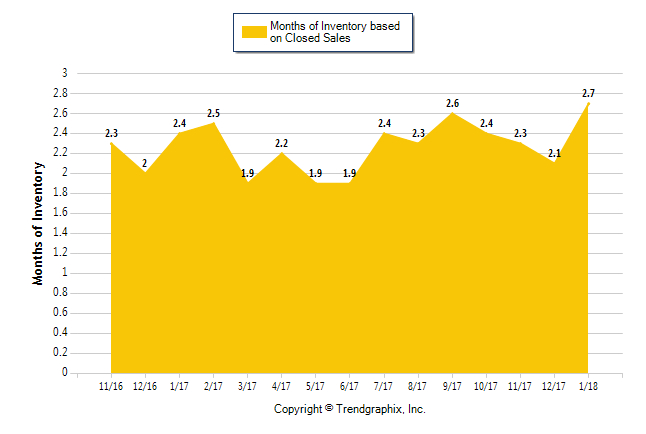
January 2018 is a Seller’s market*
Home For Sale in January 2018: 1288 units.
| • | Down 10.1% compared to last month |
| • | Up 24.3% compared to last year |
Home Closed in January 2018: 560 units.
| • | Down 35.8% compared to last month |
| • | Down 21.3% compared to last year |
Home Placed under Contract in January 2018: 803 units.
| • | Up 36.3% compared to last month |
| • | Up 23.9% compared to last year |
*Buyer’s market: more than 6 months of inventory based on closed sales
Seller’s market: less than 3 months of inventory based on closed sales
Neutral market: 3 – 6 months of inventory based on closed sales
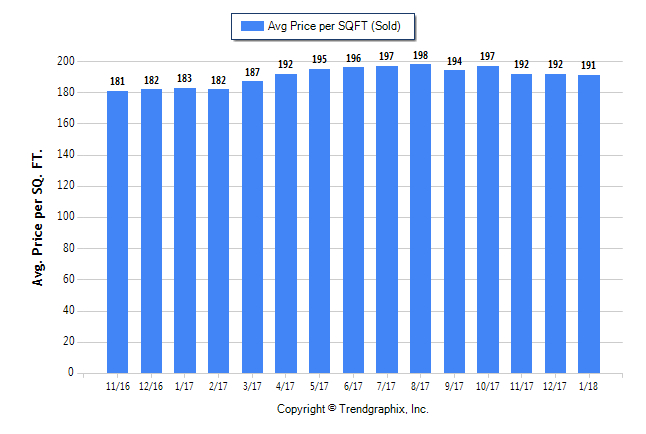
January 2018 Average Sold Price per Square Footage is Neutral*
Average Sold Price per Square Footage in January 2018:$243
| • | Up 0.4% compared to last month |
| • | Up 5.2% compared to last year |
*Based on 6 month trend – Appreciating/Depreciating/Neutral
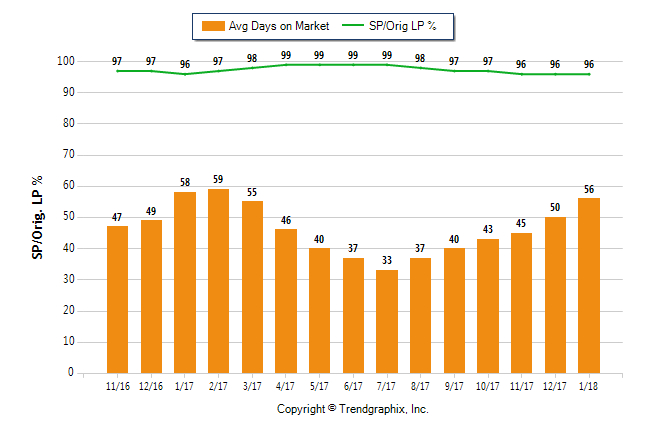
January 2018 Average Days on Market trend is Rising*
Average Days on Market in January 2018: 44
| • | Up 15.8% compared to last month |
| • | 0% compared to last year |
January 2018 Sold/Original List Price Ratio is Falling*
Sold/Original List Price % in January 2018: 96%
| • | 0% compared to last month |
| • | Down 1% compared to last year |
*Based on 6 month trend – Rising/Falling/Remains Steady
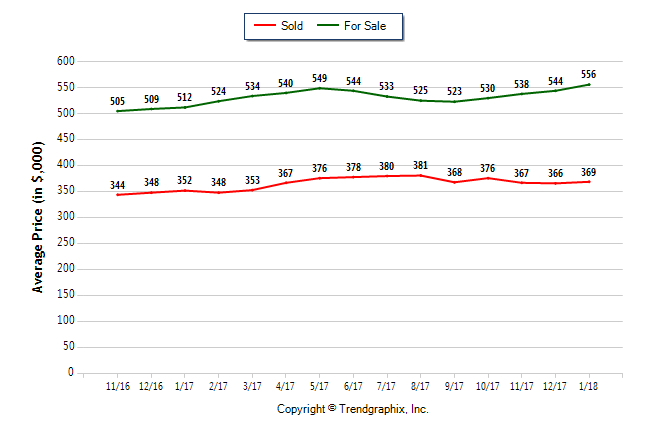
January 2018 Average For Sale Price is Appreciating*
Average For Sale Price (in thousand) in January 2018: $642
| • | Up 4.2% compared to last month |
| • | Up 4.2% compared to last year |
January 2018 Average Sold Price is Neutral*
Average Sold Price (in thousand) in January 2018: $462
| • | Up 2.9% compared to last month |
| • | Up 5.5% compared to last year |
*Based on 6 month trend – Appreciating/Depreciating/Neutral
|
January 2018 is a Seller’s market* Months of Inventory based on Closed Sales in January 2018: 2.3
|
||||||