By Living Room Realty, March 8, 2018
February 2018 is a Seller’s market*
Home For Sale in February 2018: 1236 units.
| • | Down 4% compared to last month |
| • | Up 21.4% compared to last year |
Home Closed in February 2018: 625 units.
| • | Up 4.2% compared to last month |
| • | Up 2.1% compared to last year |
Home Placed under Contract in February 2018: 789 units.
| • | Up 3.1% compared to last month |
| • | Down 4.5% compared to last year |
*Buyer’s market: more than 6 months of inventory based on closed sales
Seller’s market: less than 3 months of inventory based on closed sales
Neutral market: 3 – 6 months of inventory based on closed sales
|
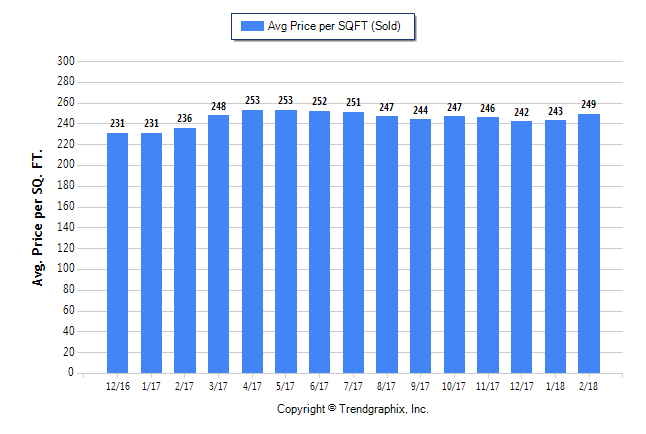
February 2018 Average Sold Price per Square Footage is Neutral* Average Sold Price per Square Footage in February 2018:$249
|

|
February 2018 Average Days on Market trend is Rising* Average Days on Market in February 2018: 50
Sold/Original List Price % in February 2018: 96%
|
||||||||||
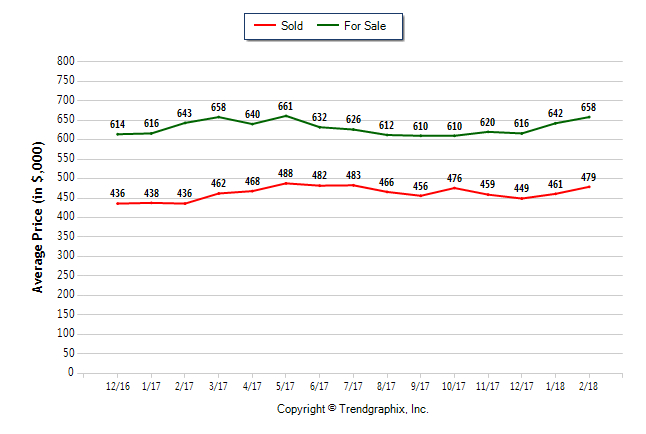
February 2018 Average For Sale Price is Appreciating*
Average For Sale Price (in thousand) in February 2018: $658
| • | Up 2.5% compared to last month |
| • | Up 2.3% compared to last year |
February 2018 Average Sold Price is Neutral*
Average Sold Price (in thousand) in February 2018: $479
| • | Up 3.9% compared to last month |
| • | Up 9.9% compared to last year |
*Based on 6 month trend – Appreciating/Depreciating/Neutral
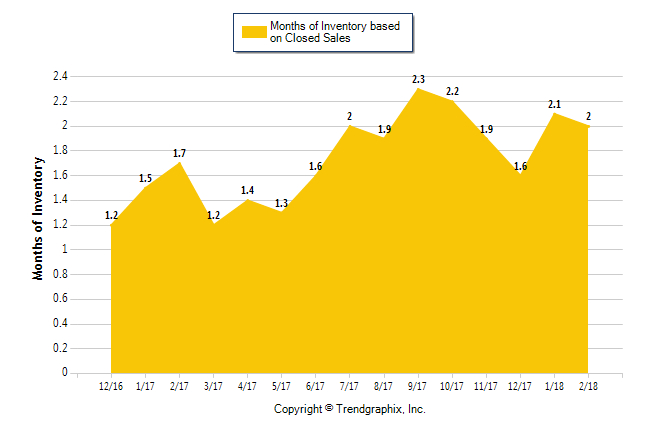
February 2018 is a Seller’s market*
Months of Inventory based on Closed Sales in February 2018: 2
| • | Down 4.7% compared to last month |
| • | Up 18% compared to last year |
*Buyer’s market: more than 6 months of inventory based on closed sales
Seller’s market: less than 3 months of inventory based on closed sales
Neutral market: 3 – 6 months of inventory based on closed sales