By Living Room Realty, July 15, 2019
The patterns are what I find the most interesting about these market reports. Look below how similar the data pattern of pending sales and inventory are from April – July of 2018 and April – July of 2019. The same general shape with a peak in June for pending sales and then a slight dip. The same for inventory with it increasing month over month during that time period.
What is different though? It is still a seller’s market with tons of demand and not as much supply. But the gap isn’t as huge as last year. Same shape and pattern but with a bit more inventory than the year previously. This is why we still find sellers getting a good price for their homes but buyers not having as tough a time as they were a few years ago. Portland is still ?hot hot hot ? but it is more balanced than before and more fun for us agents who can still negotiate on behalf of a buyer to get them a great home without offering naming rights to their first born or free pizza for life. Still a window of opportunity for both sides!
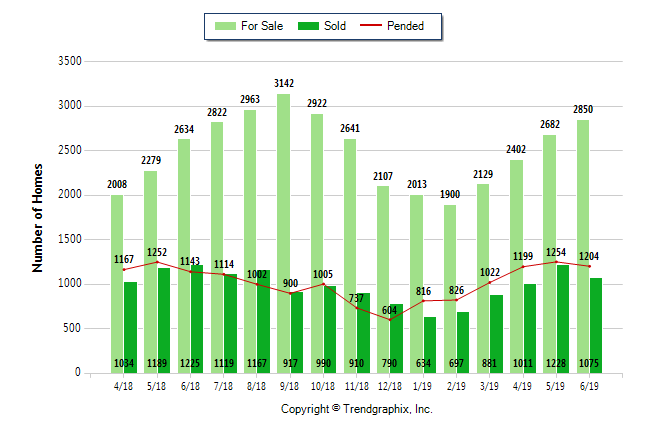
June 2019 is a Seller’s market*
Home For Sale in June 2019: 2850 units.
•Up 6.3% compared to last month
•Up 8.2% compared to last year
Home Closed in June 2019: 1075 units.
•Down 12.5% compared to last month
•Down 12.2% compared to last year
Home Placed under Contract in June 2019: 1204 units.
•Down 4% compared to last month
•Up 5.3% compared to last year
*Buyer’s market: more than 6 months of inventory based on closed sales
Seller’s market: less than 3 months of inventory based on closed sales
Neutral market: 3 – 6 months of inventory based on closed sales